Intertidal zonation patterns at Goat Island refer to the distinct horizontal bands of marine organisms distributed between the high and low tide marks within the Cape Rodney-Okakari Point Marine Reserve. These patterns are driven by abiotic stressors like desiccation and wave action at upper levels, and biotic interactions such as predation and competition at lower levels, creating stratified communities of barnacles, mollusks, and macroalgae.
What Defines the Intertidal Zonation Patterns at Goat Island?
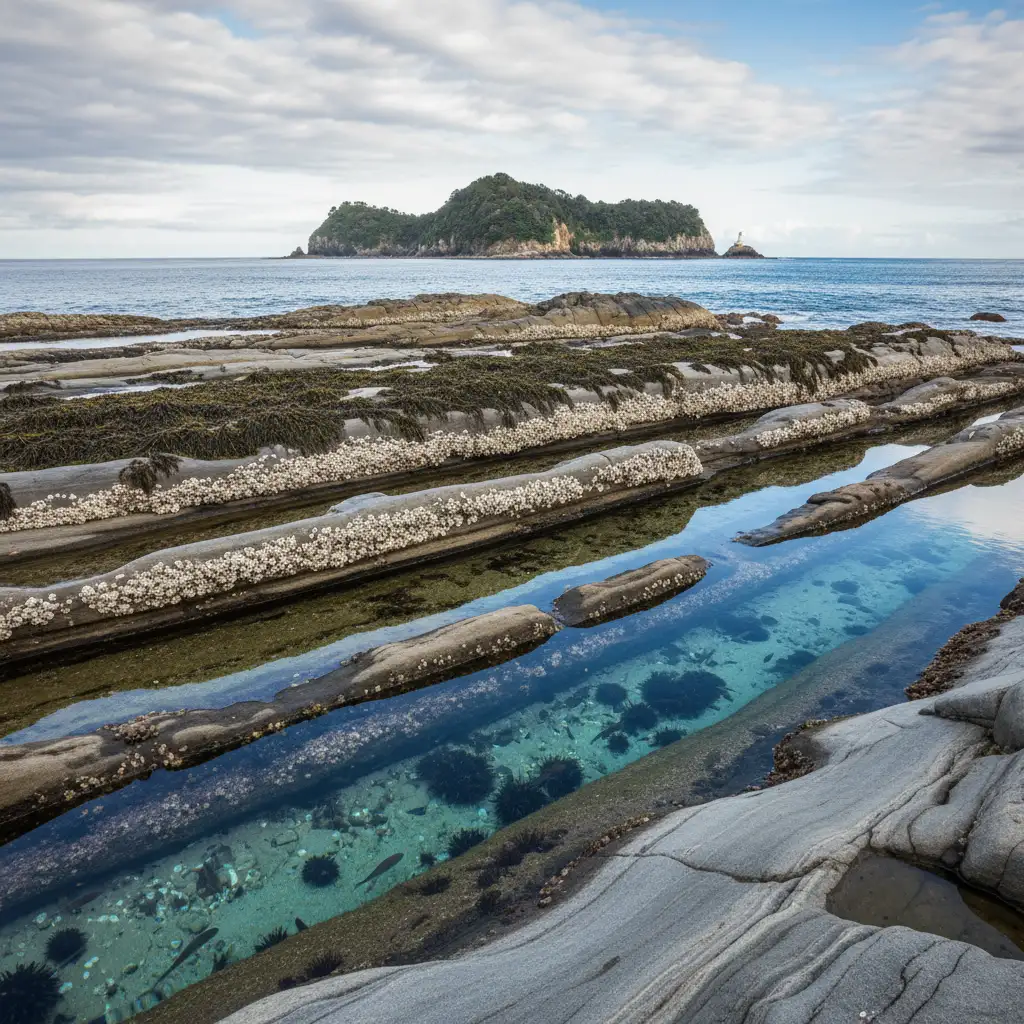
The Cape Rodney-Okakari Point Marine Reserve, commonly known as Goat Island, serves as New Zealand’s premier laboratory for observing marine ecology. Established in 1975 as the country’s first no-take marine reserve, it offers a baseline for natural zonation patterns undisturbed by fishing pressure. The intertidal zone here—the area of the foreshore that is exposed to the air at low tide and submerged at high tide—exhibits a classic “universal” zonation pattern, yet it is uniquely influenced by the temperate waters of the Hauraki Gulf.
At Goat Island, the rocky shore environment allows for the clear demarcation of life. Unlike sandy shores where species burrow and hide, the greywacke rock substrate provides a stable attachment point for sessile organisms. Visitors and researchers can observe distinct bands of life that change rapidly over a distance of just a few meters. This vertical stratification is not random; it is a highly organized biological response to the harsh gradients of the shore environment.
The Vertical Zones of Leigh
Biologists typically divide the Goat Island intertidal area into four primary zones. Understanding these zones is critical for interpreting the data collected during transect surveys.
- The Splash Zone (Supralittoral): This area is rarely submerged, receiving moisture only from wave spray. Dominant species here include the tiny blue periwinkle (Austrolittorina antipodum) and lichens. These organisms are extremophiles in a sense, capable of withstanding intense heat, high salinity, and prolonged desiccation.
- The High Tide Zone (Upper Littoral): Submerged only during high tide, this zone is dominated by barnacles, specifically the column barnacle (Chamaesipho columna). You will also find the brown barnacle (Chamaesipho brunnea) on more exposed faces. The competition here is for space, but the primary constraint is the ability to close up tight and retain moisture when the tide is out.
- The Mid Tide Zone (Mid Littoral): This is the most biologically active band for stationary animals. It is characterized by the presence of oysters (Crassostrea gigas) and tubeworms. In sheltered areas, you will see the iconic Neptune’s Necklace (Hormosira banksii), a bead-like algae that provides a canopy for smaller invertebrates to hide from the sun and predators.
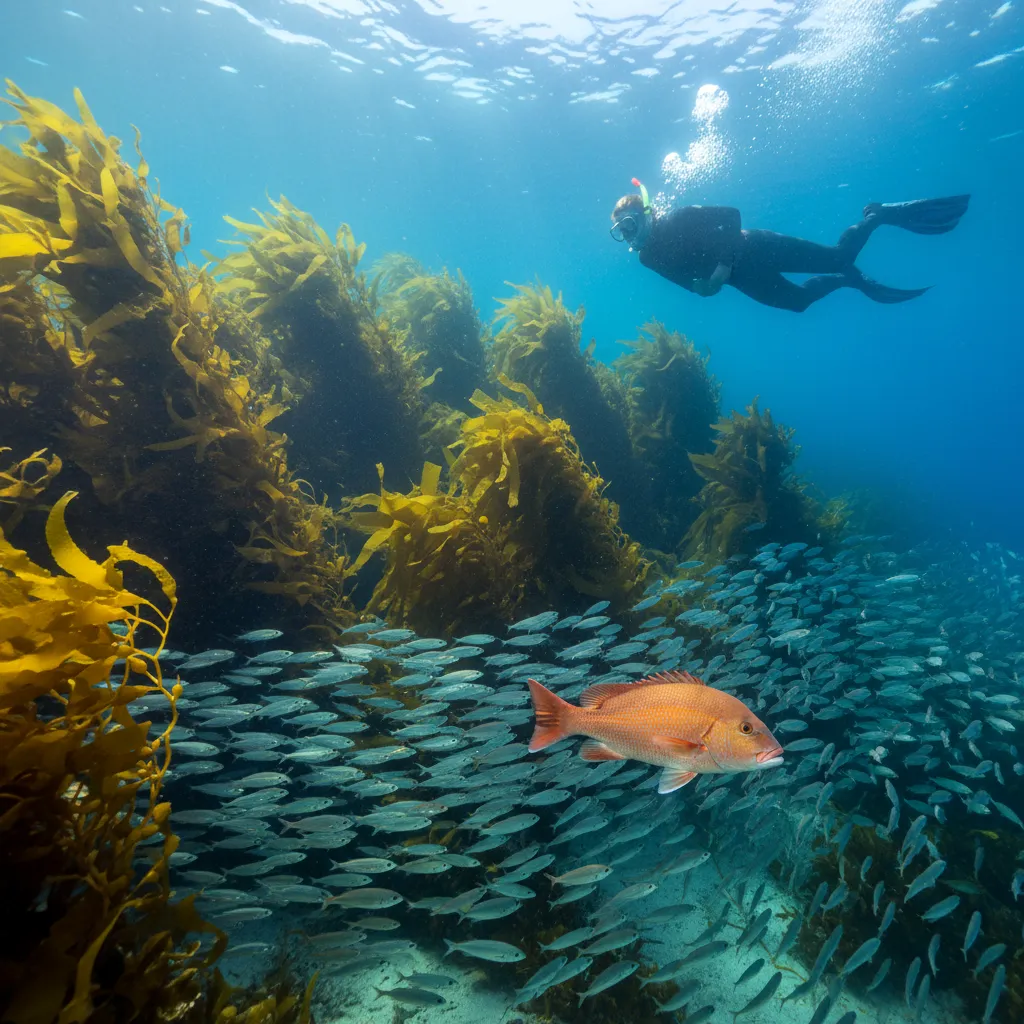
- The Low Tide Zone (Lower Littoral): Exposed only during the lowest spring tides, this area is teeming with life that cannot tolerate drying out. It is dominated by large brown macroalgae, specifically Ecklonia radiata (common kelp) and Carpophyllum species. This zone transitions into the subtidal zone, where the marine reserve’s famous vertebrate populations reside.
How Do Abiotic and Biotic Factors Influence Distribution?
The distribution of species at Goat Island follows a fundamental rule of marine ecology: Upper limits are set by physical stress, while lower limits are set by biological interactions.
Physical (Abiotic) Stressors
As you move up the shore away from the water, the environment becomes increasingly hostile. Organisms must cope with:
- Desiccation: The risk of drying out is the single biggest factor. Barnacles have evolved opercular plates to seal themselves shut, while algae like Hormosira contain water-filled cells to resist dehydration.
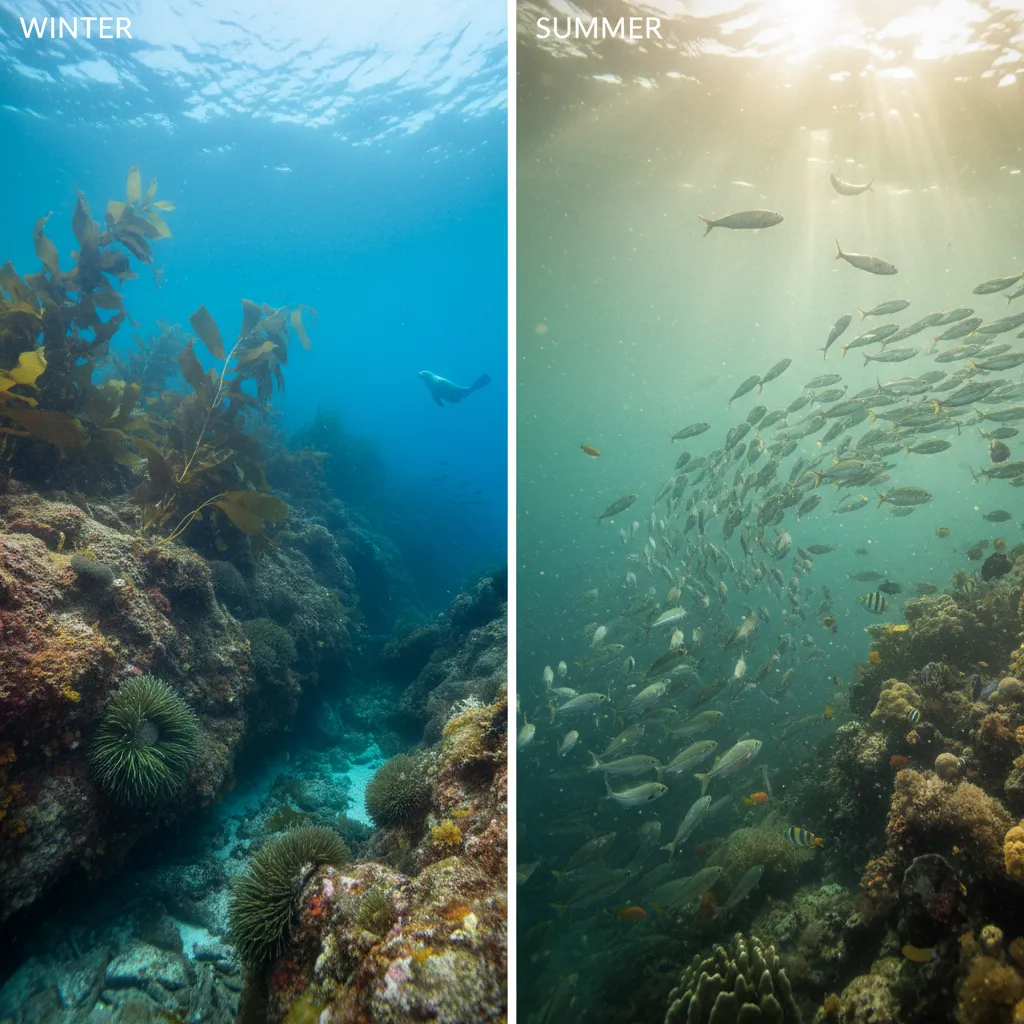
- Temperature Fluctuation: Air temperature varies far more than sea temperature. Intertidal species must withstand the baking New Zealand summer sun and the cold winter winds.
- Wave Action: On the exposed northern faces of Goat Island, the mechanical force of waves can rip organisms from the rock. This dictates that only species with strong holdfasts (like kelp) or strong cement (like barnacles) can survive in high-energy zones.
Biological (Biotic) Interactions
As you move down the shore, the environment becomes more benign, but the neighborhood becomes dangerous. The lower limits of a species’ zone are usually determined by:
- Predation: Whelks (carnivorous snails) and starfish are mobile predators that require water to move. They cannot hunt effectively in the upper zones, allowing prey species like barnacles a refuge high on the rock.
- Competition: In the low intertidal zone, space is at a premium. Fast-growing algae like Ecklonia will shade out slower-growing species, and encrusting sponges will overgrow bare rock, preventing barnacle larvae from settling.

Key Species Distribution: Snapper, Crayfish, and Urchins
While the intertidal zone is fascinating, the subtidal data from Goat Island provides the most compelling evidence for the efficacy of marine reserves. The “Big Three” species often studied in relation to zonation and reserve health are the Snapper, the Spiny Rock Lobster (Crayfish), and the Sea Urchin (Kina).
Snapper (Pagrus auratus)
In unprotected areas of the Hauraki Gulf, legal-sized snapper are rare and skittish. Within the Goat Island reserve, zonation data changes drastically. Snapper are found in high densities even in shallow subtidal waters (just below the low tide mark). Research indicates that resident snapper within the reserve are larger and more abundant than outside the boundaries. These predators play a crucial role in controlling the population of grazers in the lower zones.
Spiny Rock Lobster (Jasus edwardsii)
Crayfish are a keystone predator in the rocky reef ecosystem. Historical transect data shows a significant recovery of crayfish biomass within the reserve compared to the fished coastlines nearby. They are nocturnal foragers that move up into the shallow subtidal and low intertidal zones at night to feed on urchins and mollusks. Their presence is a primary driver of the benthic community structure.
Sea Urchins / Kina (Evechinus chloroticus)
The distribution of Kina is perhaps the most significant indicator of reef health. In the absence of predators (snapper and crayfish), Kina populations explode. They graze voraciously on kelp, stripping the rocks bare. This results in “Urchin Barrens”—areas of pink, coralline-encrusted rock void of productive kelp forests. At Goat Island, the zonation data tells a story of recovery: as predator numbers rose, Kina numbers in the open reef fell, retreating to crevices, allowing the kelp forest to regenerate.
Kite Diagrams & Transect Sampling Methodologies
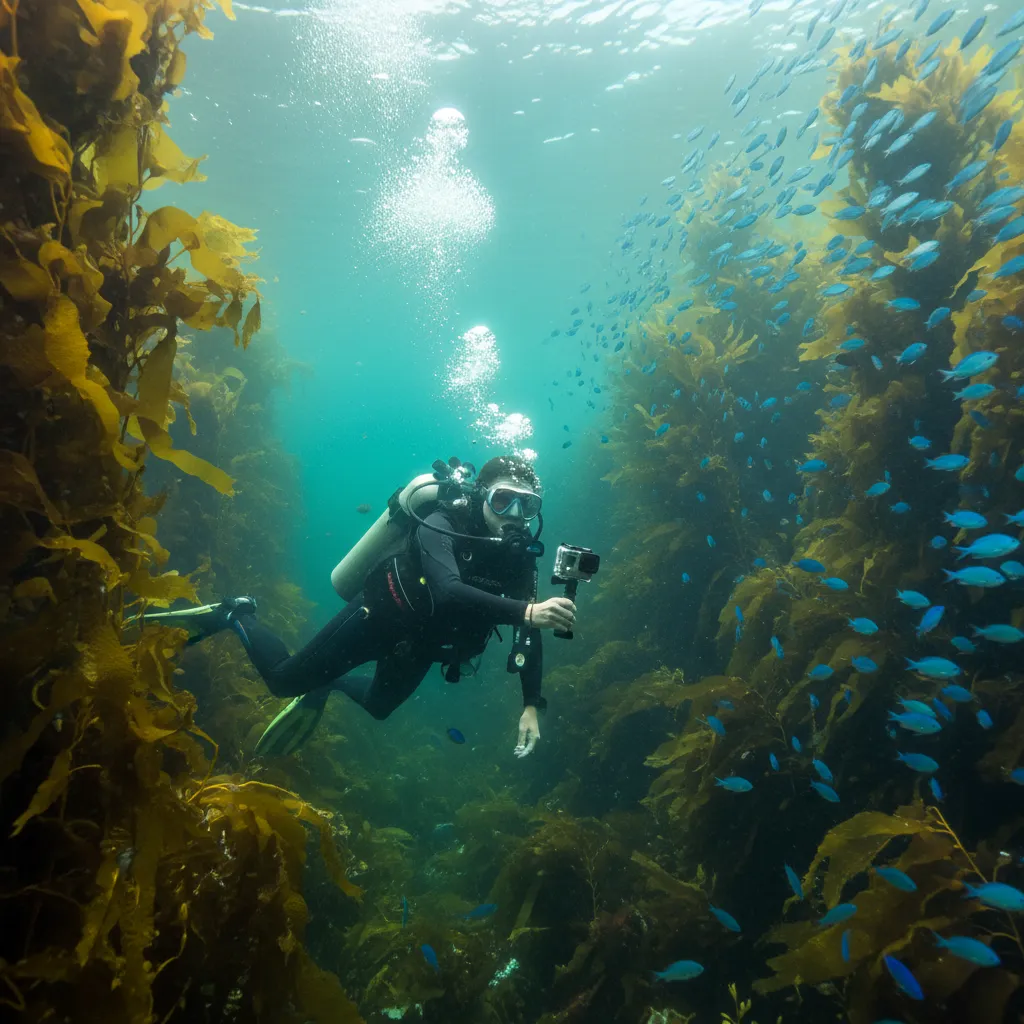
How do scientists quantify these patterns? To move from anecdotal observation to hard data, marine biologists employ systematic sampling methods. The most common techniques used by students and researchers at the University of Auckland’s Leigh Marine Laboratory are the line transect and the quadrat survey.
Conducting a Transect Survey
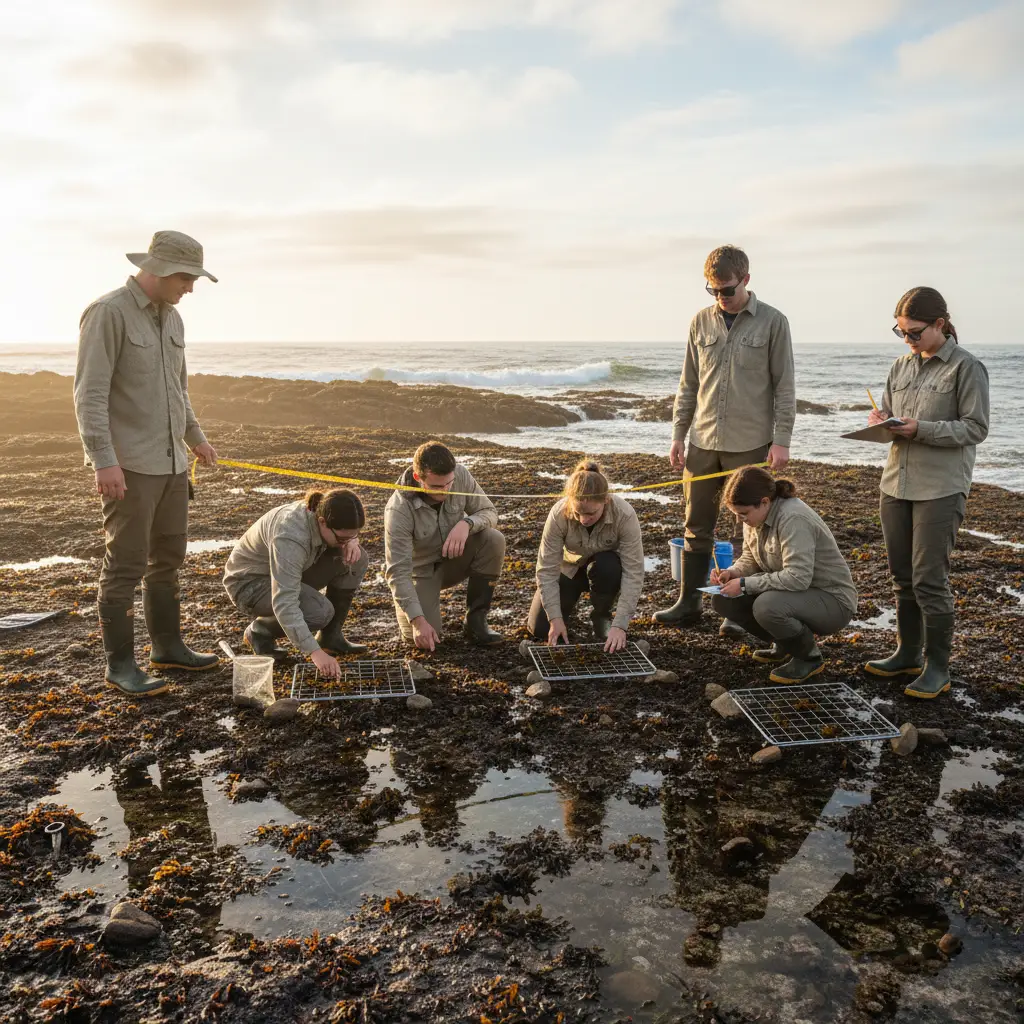
A transect line (usually a tape measure) is laid perpendicular to the shore, extending from the high tide mark down to the low tide mark. This line crosses all the vertical zones. At regular intervals (e.g., every 2 meters), a quadrat (a square frame, typically 0.25m²) is placed on the rock.
Researchers then count the abundance of specific species inside the quadrat or estimate the percentage cover of algae. This data provides a snapshot of species density relative to tidal height.
Interpreting Kite Diagrams
The data collected from transects is visually represented using Kite Diagrams. These are essential tools for understanding zonation:
- The Y-Axis: Represents the distance from the high tide mark (or height above chart datum).
- The X-Axis: Represents the abundance of different species.
- The Shape: The graph mirrors itself on both sides of a central line (resembling a kite). A wide shape indicates high abundance at that specific tidal height; a narrow shape or line indicates low abundance or absence.
By reading a kite diagram of Goat Island, one can instantly visualize the overlapping ranges of species. For example, you would see a wide kite for Chamaesipho barnacles at the top of the chart, which tapers off to nothing as the kite for Hormosira algae begins to widen in the mid-section.
Historical Data: Protection Effects on Species Density
The value of Goat Island lies in its long-term dataset. Since 1975, researchers have monitored the biological changes resulting from the cessation of fishing. This historical context provides a “control” against which the effects of fishing elsewhere can be measured.
The Reserve Effect
Comparison studies between the reserve and adjacent non-reserve areas (like Matheson Bay) reveal stark contrasts. Inside the reserve, the biomass of snapper is estimated to be more than 10 times higher than in surrounding fished areas. Furthermore, the size structure is different; the reserve contains large, old individuals which are disproportionately important for reproduction.
For the intertidal and shallow subtidal zones, the historical data highlights the resilience of the ecosystem. When protection was implemented, the expectation was simply “more fish.” The reality was a complete restructuring of the ecosystem’s zonation and energy flow.
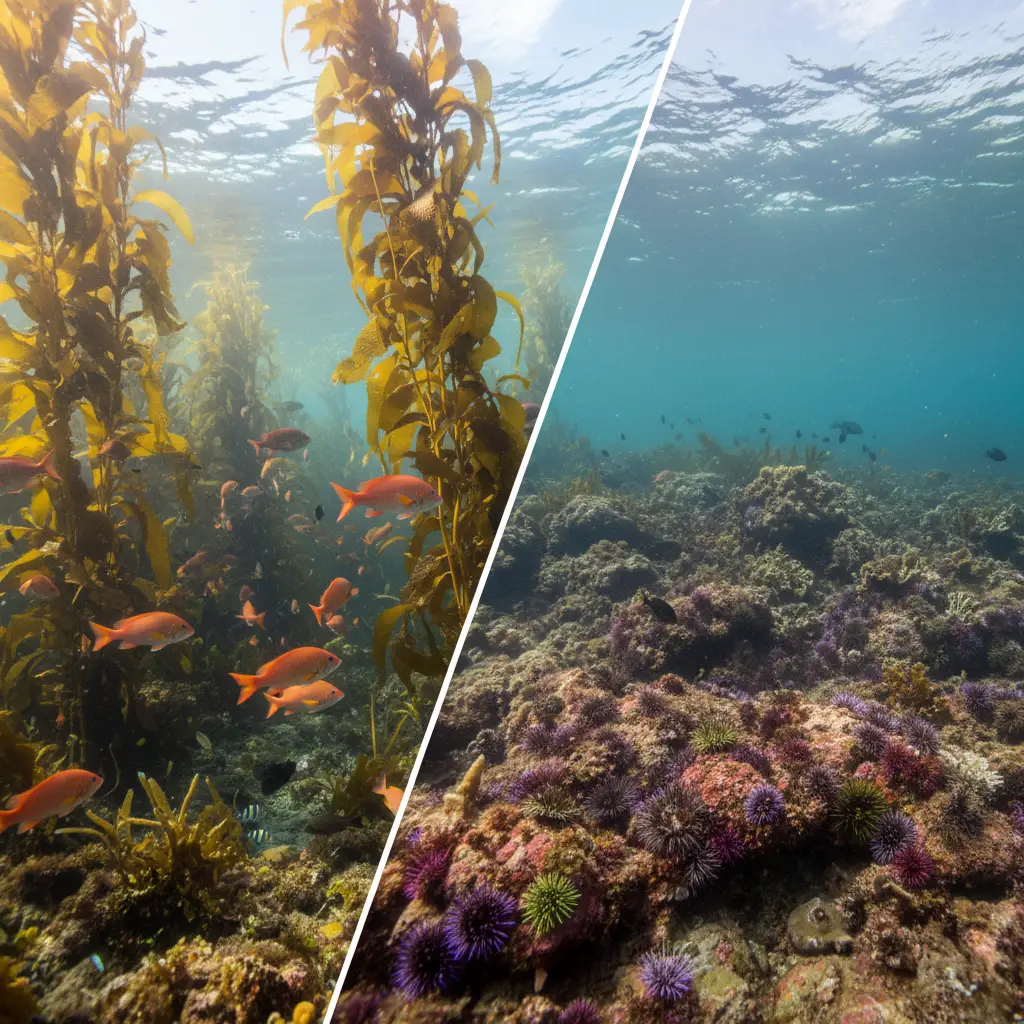
The Trophic Cascade: Kelp vs. Barrens
The most profound lesson from the Goat Island data is the concept of the Trophic Cascade. This phenomenon describes how changes at the top of the food web ripple down to affect the bottom.
The Mechanism:
1. Protection: Fishing stops. Snapper and Crayfish populations recover.
2. Predation: These predators consume large numbers of Kina (Urchins).
3. Behavioral Change: Surviving Kina are forced to hide in crevices to avoid predation, rather than grazing openly.
4. Recovery: With grazing pressure reduced, Ecklonia radiata (kelp) spores can settle and grow.
5. Habitat Restoration: The kelp forest returns, providing three-dimensional habitat for hundreds of other species, increasing overall biodiversity.
In areas outside the reserve, where large predators are fished out, the cascade works in reverse, leading to the prevalence of urchin barrens. This data validates the importance of marine reserves not just for saving fish, but for preserving the structural integrity of the entire marine habitat.
Conclusion
The intertidal zonation patterns at Goat Island are more than just bands of shellfish and seaweed; they are a living narrative of ecological balance. Through the use of transect methodologies and kite diagrams, we can visualize how physical forces shape the shore. However, the subtidal data reveals that biological forces—specifically the presence of top predators like snapper and crayfish—are equally critical in determining what the underwater landscape looks like. Goat Island remains a crucial educational resource, demonstrating that when nature is protected, the complex architecture of the marine environment can restore itself.
What is the main cause of zonation at Goat Island?
Zonation at Goat Island is caused by a combination of abiotic factors (physical stress) and biotic factors (biological interactions). The upper limits of a species’ range are generally determined by their ability to survive desiccation (drying out) and heat, while the lower limits are determined by competition for space and predation by mobile marine animals.
Why are there so many sea urchins (kina) outside the reserve?
Large populations of sea urchins outside the reserve are typically the result of overfishing their natural predators, specifically large snapper and spiny rock lobsters. Without these predators to control their numbers, urchins graze freely, often destroying kelp forests and creating “urchin barrens.”
What is a kite diagram used for in marine biology?
A kite diagram is a graphical tool used to show the zonation and abundance of species along a transect line. The width of the “kite” at any given point represents the density or percentage cover of a species at that specific distance or tidal height, allowing for easy visualization of species distribution patterns.
What are the dominant species in the mid-tide zone at Leigh?
The mid-tide zone at Leigh (Goat Island) is typically dominated by filter feeders and grazers that can tolerate moderate exposure. Common species include the Pacific oyster, tubeworms, and the distinctive bead-like brown algae known as Neptune’s Necklace (Hormosira banksii).
How does the marine reserve status affect the intertidal zone?
While fishing bans primarily protect subtidal fish, the effects cascade to the intertidal zone. Increased predator density in the reserve reduces the population of grazers like urchins. This reduction in grazing pressure allows macroalgae (kelp) to flourish in the low intertidal and shallow subtidal zones, altering the community structure compared to unprotected areas.
What is the scientific name for the common kelp found at Goat Island?
The common kelp forest forming species found in the low intertidal and subtidal zones at Goat Island is Ecklonia radiata. It is a foundational species that provides food and shelter for a vast array of marine organisms.